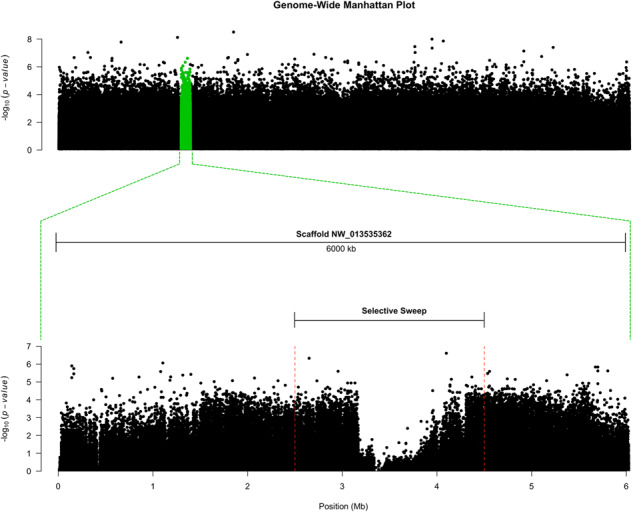
Fig. 4.

Manhattan plot for the tree tested populations of Amyelois transitella. The plot is based on the P values of Mahalanobis distances between calculated z scores derived from regressing each SNP by 2 principal components (k = 2). For details, see Materials and Methods. Highly differentiated SNPs were screened based of FDR-corrected P values (supplementary table S5, Supplementary Material online).
