Figure 6.
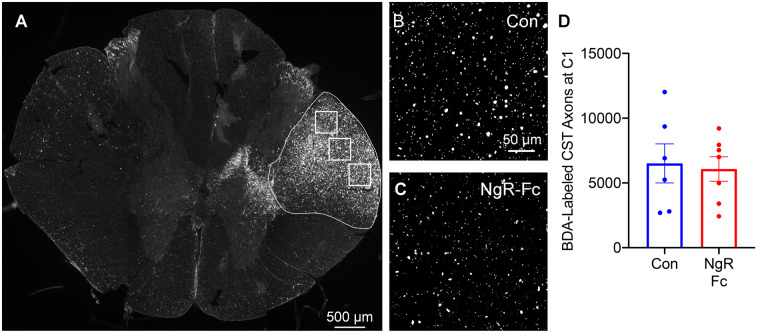
Efficiency of BDA tracing in CST. (A) A transverse section of spinal cord at the C1 level was stained for BDA-labelled CST fibres. Three high-magnification images from the regions shown by white boxes were used for quantification of total density in right dorso-lateral CST outlined in white. Scale bar = 500 µm. (B and C) Representative of high-magnification images of BDA-labelled CST axons in the right lateral column at C1 level from a vehicle-treated animal (B) and a NgR-Fc-treated animal (C). Scale bar = 50 µm. (D) Quantification of BDA-labelled CST axons at C1 spinal cord. No statistically significant difference between groups. Data are mean ± SEM, unpaired two-tailed t-test.

