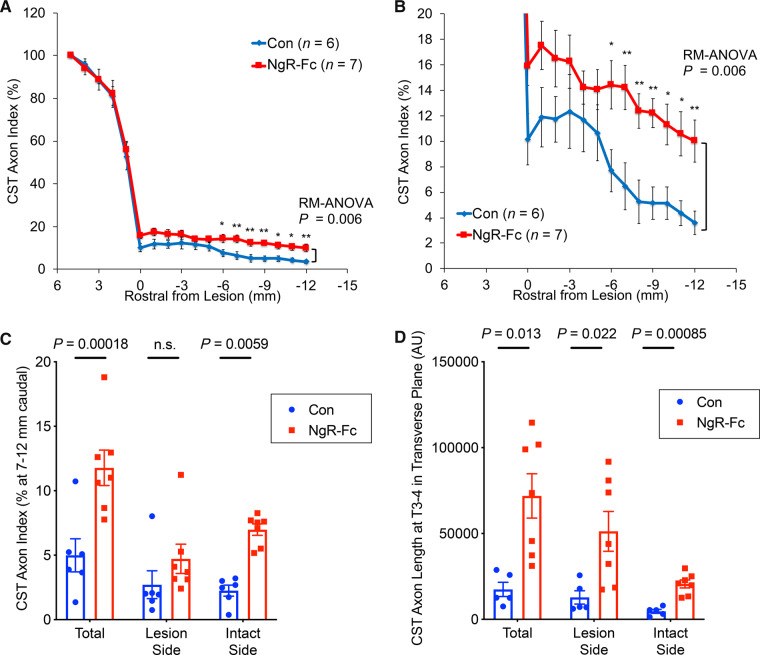
Figure 8.
Quantification of BDA-labelled CST axons. (A) CST fibre counts from horizontal sections, as in Fig. 7, are reported by an axon index relative to the most rostral count, and are plotted as a function of rostral-caudal distance relative to the SCI site. Repeated measures ANOVA caudal to the lesion show a significant greater fibre count (P = 0.006) in the NgR-Fc group, with post hoc pairwise comparisons at the indicated distances *P < 0.05; **P < 0.01. Data are mean ± SEM. (B) Enlarged view of graph from A from the lesion centre to 12 mm caudal to the injury. (C) The average CST axon index from 7–12 mm caudal to the injury on the lesion side, on the intact side and on both sides of the spinal cord. There was statistically greater CST fibre density in the NgR-C group overall, and on the intact side. Unpaired two-tailed t-test with Holm-Sidak correction for multiple comparisons. Mean ± SEM, with individual animals indicated. (D) Transverse sections of the spinal cord caudal to the lesion site at the T3-T4 level were stained for BDA-labelled CST fibres. The CST axon length per area in the grey matter of the lesion side and the intact side was measured for control (Con) and NgR-Fc groups. Unpaired two-tailed t-test with Holm-Sidak correction for multiple comparisons. Mean ± SEM, with individual animals indicated.

