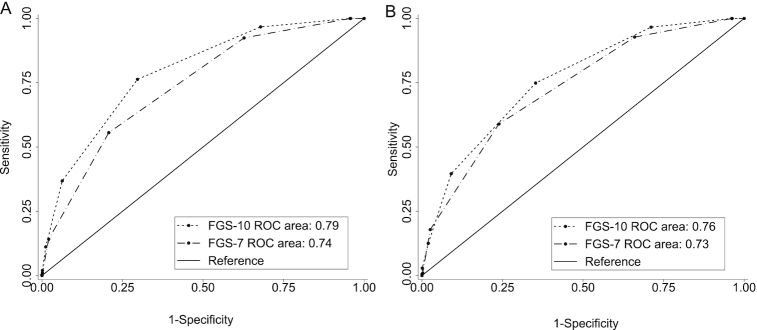
FIGURE 2.
Receiver operating characteristic curves of FGS-10 (based on MDD-W) and FGS-7 (based on MDD-IYC): predictions for children of MPAs (A) >0.75 and (B) >0.8. FGS-7, food group score out of 7 food groups based on the WHO infant and young child feeding minimum dietary diversity (MDD-IYC) guidelines; FGS-10, food group score out of 10 food groups based on the FAO/FHI360 minimum dietary diversity for women (MDD-W) guidelines; MPA, mean probability of adequacy.

