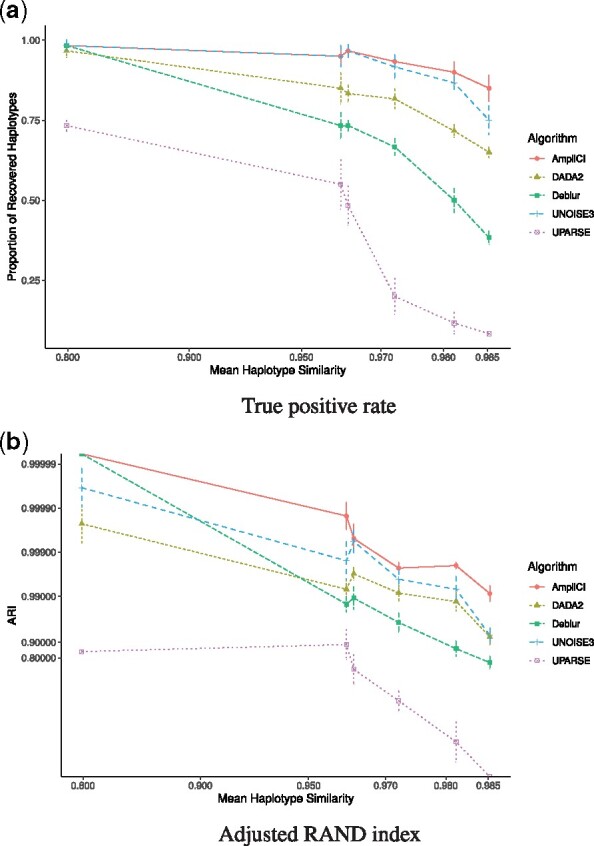
Fig. 2.

Mean (a) proportion of detected haplotypes ± standard error and (b) ARI ± standard error for six levels of simulated haplotype similarity. For each level, the x coordinate is set to the mean haplotype similarity of the five simulated datasets. Mean haplotype similarity (x axis) and ARI plotted on logit scale; ARI standard error computed by the delta method.
