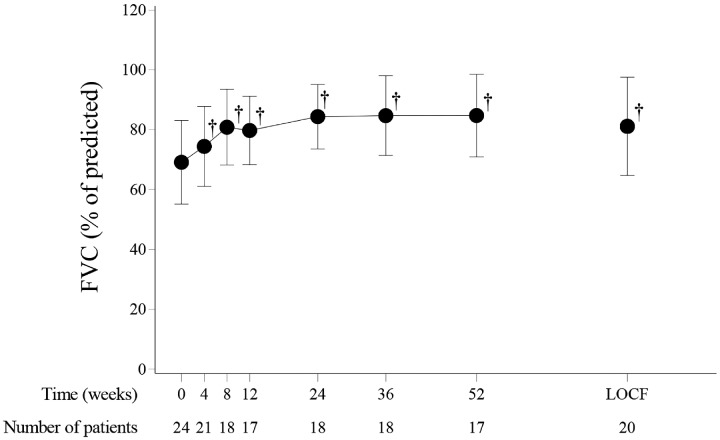
Fig. 2.
Changes in FVC (% of predicted) in prospective investigation group patients
Points and bars represent the mean and s.d., respectively. †P < 0.001, paired t-test, compared against baseline. FVC: forced vital capacity; LOCF: the end-of-the-study data for all patients using the last-observation-carried-forward method.

