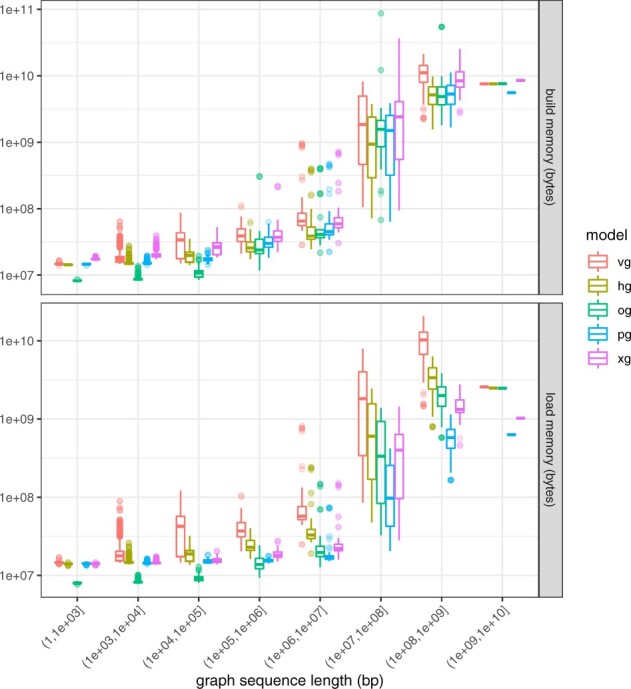
Fig. 3.

Memory requirements for model construction and loading. Memory costs versus graph sequence size for the graph collection, colored by HandleGraph model. The memory requirements for graph construction tend to be higher than those for loading the graph model. All methods show fixed overheads of several megabytes, seen in the flat tail to the left of both plots. Outside of this region, all methods show roughly linear scaling in both build and load costs per input base pair. The relative differences in memory costs appear to be stable between different methods across many orders of magnitude in graph size. (Color version of this figure is available at Bioinformatics online.)
