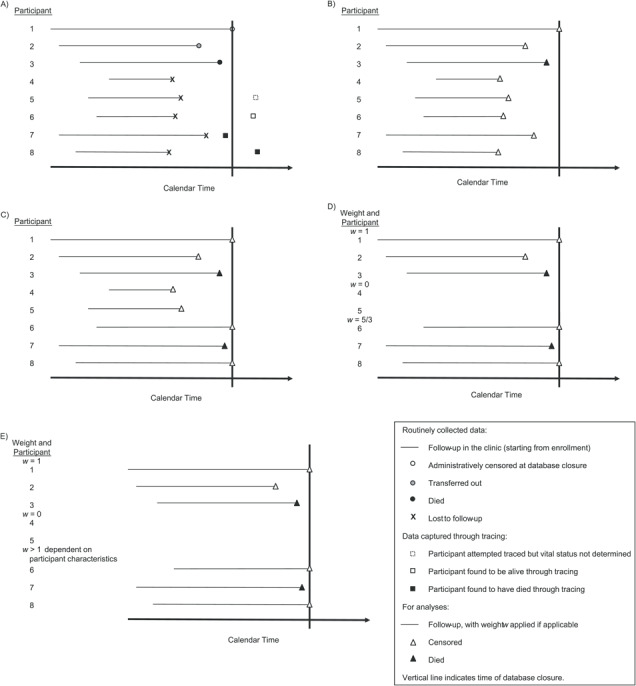
Figure 1.

Data captured routinely and through tracing among KIULARCO participants and how it translated to analysis, Ifakara, Tanzania, 2005–2015. A) Illustration of data captured routinely and through tracing for 10 example participants. The horizontal lines indicate follow-up in the clinic starting from enrollment, and the vertical line indicates database closure. Participant 1 remained under active follow-up until administrative censoring (white circle) at database closure. Participant 2 transferred to another clinic, and this was captured in the routine database (gray circle). Participant 3 died, and this was captured in the routine database (black circle). Participants 4–8 were lost to follow-up from the routine database (“X”). Participant 4 was not selected for tracing. An attempt was made to trace participant 5, but vital status was not determined; therefore, no further data were available beyond those in the routine database (the dotted white square indicates the time at which tracing was attempted, but this has no other implication for data interpretation for this participant). Participant 6 was successfully traced and found to be alive (the white square indicates the time at which tracing was performed and therefore the time at which the participant was last known to be alive). Participant 7 was successfully traced and was found to have died before database closure (black square indicates date of death). Participant 8 was successfully traced and was found to have died after database closure (black square indicates date of death). B) Illustration of how the data were used in the analysis under method A (see text for methods) using data captured routinely (straightforward time-to-event analysis). The participants contributed follow-up time as indicated by the horizontal lines, and all participants were censored (white triangles), except for participant 3, who died (black triangle). C) Illustration of how the data were used in the analysis under method B, that is, updating the routinely collected data with information obtained through tracing. Participants 1–5 were included as for method A. Participants 6 and 8 were included as alive until censored at database closure. Participant 7 was included up to the point of death (before database closure) as indicated. D) Illustration of how the data were used in the analysis under method C. Participants 1–3 were included as for methods A and B (weight w = 1). Participants 4 and 5 were excluded because they were lost to follow-up and not successfully traced (weight w = 0). Participants 6–8 were included with weights w = 5/3, that is, upweighted to account for the exclusion of participants 4 and 5. As for method B, participants 6 and 8 were included as alive up to the date of database closure, and participant 7 was included up to the point of death. E) Illustration of how the data were used in the analysis under method D. The approach was the same as that for method C, except that the weights applied to participants 6–8 were based on participant characteristics, through the probabilities of being attempted traced and successfully traced. KIULARCO, Kilombero and Ulanga Antiretroviral Cohort.
