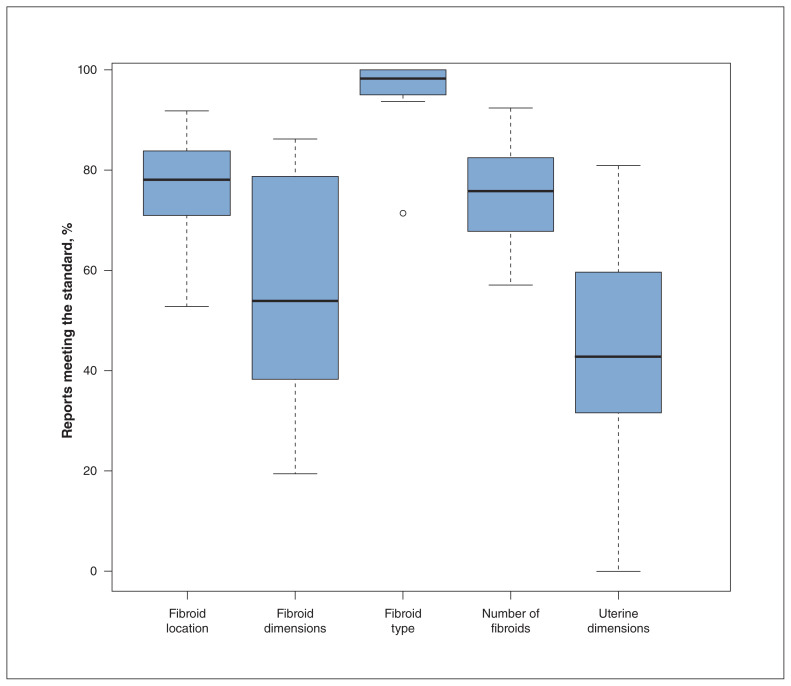
Figure 1:
Distribution of ultrasonography reports that met each quality criterion. Note: Bold horizontal bars are the medians, lower and upper horizontal bars of the box are the first and third quartiles, short horizontal lines (whiskers) represent either 1.5 times the interquartile range (IQR) or the minimum and maximum as appropriate. A dot represents an outlier falling outside the whisker (1.5 × IQR).

