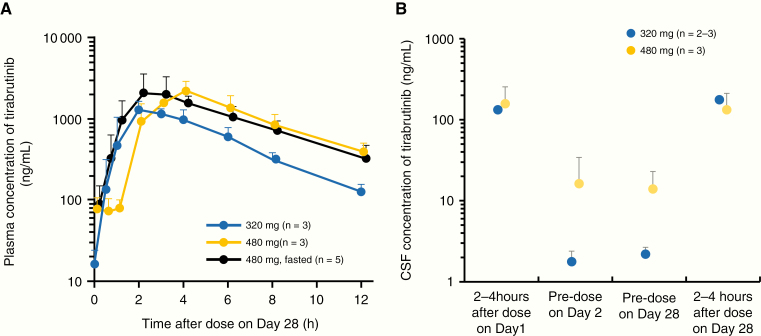
Fig. 2.
(A) Mean plasma concentration of tirabrutinib on day 28 of cycle 1. Pharmacokinetic data on day 28 in 1 out of 6 patients at the 480 mg fasted group in the pharmacokinetic analysis were unavailable. Error bars indicate standard deviation. (B) Mean CSF concentration of tirabrutinib. Data in 1 patient on day 1 and 2–4 hours after dose on day 2 were unavailable. Error bars indicate standard deviation.

