. 2020 Nov 24;298(2):353–362. doi: 10.1148/radiol.2020201603

Figure 5:

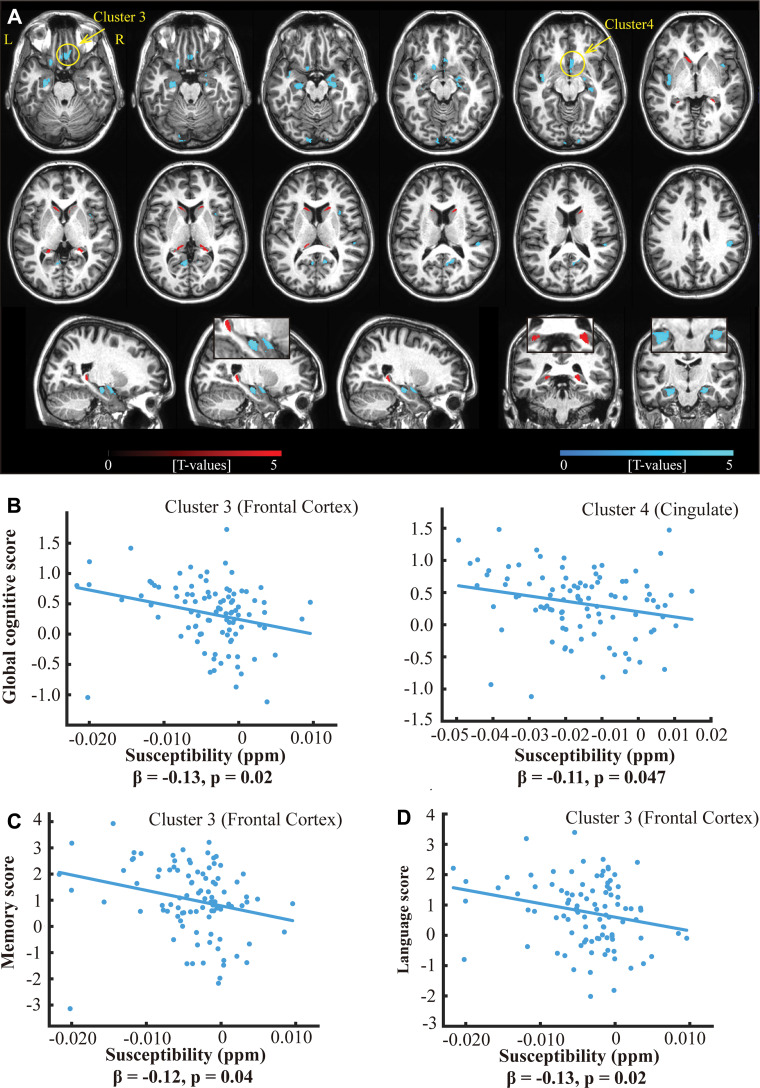
A, Overlay of regions with positive (red) and negative (cyan) correlations between iron load (ie, quantitative susceptibility mapping) and β-amyloid plaque load (PET distribution volume ratio) in all participants of the PET group (n = 97) with family-wise error−corrected cluster level significance of P value less than .05 (combined with an uncorrected voxel-level significance P < .001) and a cluster size threshold of 200 voxels on example axial slices of anatomic MRI (top two rows) and sagittal and coronal slices showing the hippocampus (bottom row). B, Scatterplot of the adjusted response data and adjusted response function of the multiple linear regression model between global cognitive composite score and susceptibility values in two clusters (marked by arrows in A), in which the cognitive composite score negatively correlates with tissue susceptibility values. Similarly, negative associations were observed between tissue susceptibility values in the frontal cortex cluster and, C, episodic memory scores and, D, language scores. All cognitive scores are continuous variables and have z-score per unit. The reported β values are standardized coefficients.

A, Overlay of regions with positive (red) and negative (cyan) correlations between iron load (ie, quantitative susceptibility mapping) and β-amyloid plaque load (PET distribution volume ratio) in all participants of the PET group (n = 97) with family-wise error−corrected cluster level significance of P value less than .05 (combined with an uncorrected voxel-level significance P < .001) and a cluster size threshold of 200 voxels on example axial slices of anatomic MRI (top two rows) and sagittal and coronal slices showing the hippocampus (bottom row). B, Scatterplot of the adjusted response data and adjusted response function of the multiple linear regression model between global cognitive composite score and susceptibility values in two clusters (marked by arrows in A), in which the cognitive composite score negatively correlates with tissue susceptibility values. Similarly, negative associations were observed between tissue susceptibility values in the frontal cortex cluster and, C, episodic memory scores and, D, language scores. All cognitive scores are continuous variables and have z-score per unit. The reported β values are standardized coefficients.