
FIG. 2.
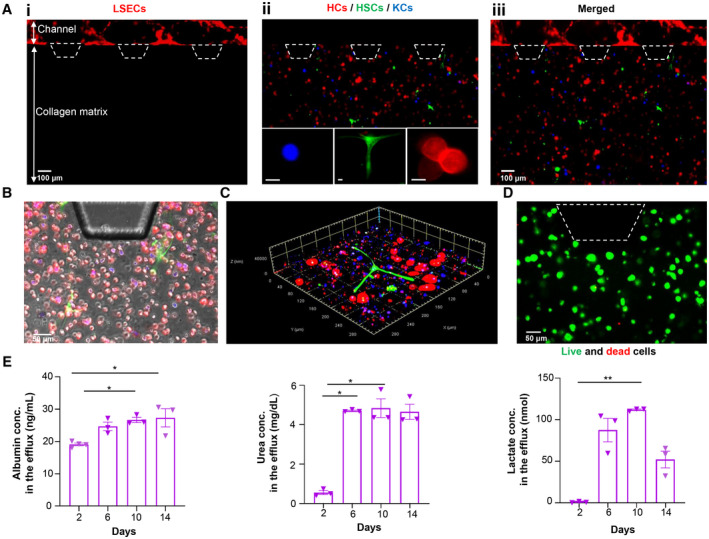
Construction of liver‐on‐a‐chip. (A) Recapitulation of the liver cellular microenvironment on a chip. (Ai) LSECs forming a continuous monolayer in the lateral channel. (Aii) Collagen compartment containing KCs (blue), HSCs (green), and HCs (red); scale bars are 25 µm. (Aiii) Merged image showing both endothelialized channel and collagen compartments. (B) Representative brightfield microscope image showing the orientation of HCs (red), HSCs (green), and KCs (blue) in the collagen matrix (gray). (C) Representative confocal microscope image of the 3D arrangement of HCs (red), HSCs (green), and KCs (blue) in a collagen matrix. (D) Live/dead assay of liver cells after 14 days of initial culture. (E) Functional activity of liver‐on‐chips, including albumin, urea, and lactate production. Data are presented as mean ± SEM; n = 3. Significance was calculated using ANOVA followed by the Kruskal‐Wallis test, *P < 0.05 and **P < 0.01. Trapezoids with dashed lines indicate the posts in the device for the collagen boundary; thus, cells are not present over the posts. Abbreviation: conc., concentration.