FIG. 5.

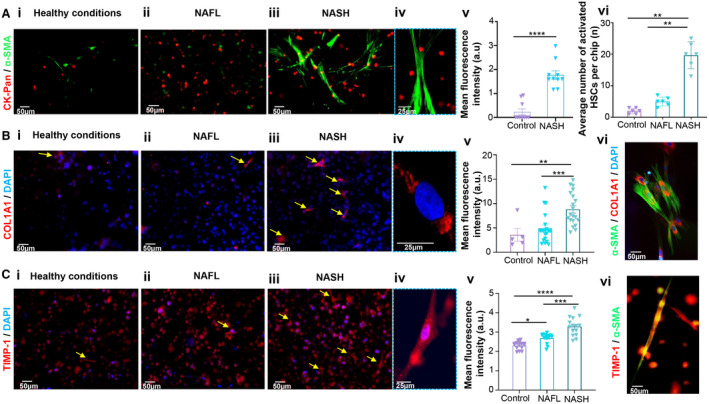
Fibrosis on‐a‐chip. (A) Representative fluorescence images of HSCs after ɑ‐SMA staining under (Ai) healthy, (Aii) NAFL, and (Aiii) NASH conditions. (Aiv) Magnified image of activated HSCs under the NASH condition. (Av) Mean fluorescence intensity of ɑ‐SMA‐stained HSCs and (Avi) average number of activated HSCs under healthy, NAFL, and NASH conditions after 10 days of disease induction. (B) Representative fluorescence images of COL1A1 staining under (Bi) healthy, (Bii) NAFL, and (Biii) NASH conditions. (Biv) Magnified image showing COL1A1 expression in HSCs under the NASH condition. (Bv) Mean fluorescence intensity of COL1A1 under healthy, NAFL, and NASH conditions after 10 days of disease induction. (Bvi) Representative fluorescence image showing COL1A1 and ɑ‐SMA expression in activated HSCs. (C) Representative fluorescence images of TIMP‐1 staining under (Ci) healthy, (Cii) NAFL, and (Ciii) NASH conditions. (Civ) Magnified image showing TIMP‐1 expression in HSCs under the NASH condition. (Cv) Mean fluorescence intensity of TIMP‐1 under healthy, NAFL, and NASH conditions after 10 days of disease induction. (Cvi) Representative fluorescence image showing TIMP‐1 and ɑ‐SMA expression in activated HSCs. Data are presented as mean ± SEM; n ≥ 10. Significance was calculated using ANOVA followed by the Kruskal‐Wallis test, *P < 0.05, **P < 0.01, ***P < 0.005, and ****P < 0.0001. Abbreviations: a.u., arbitrary units; CK‐Pan, pan‐cytokeratin; DAPI, 4′,6‐diamidino‐2‐phenylindole.
