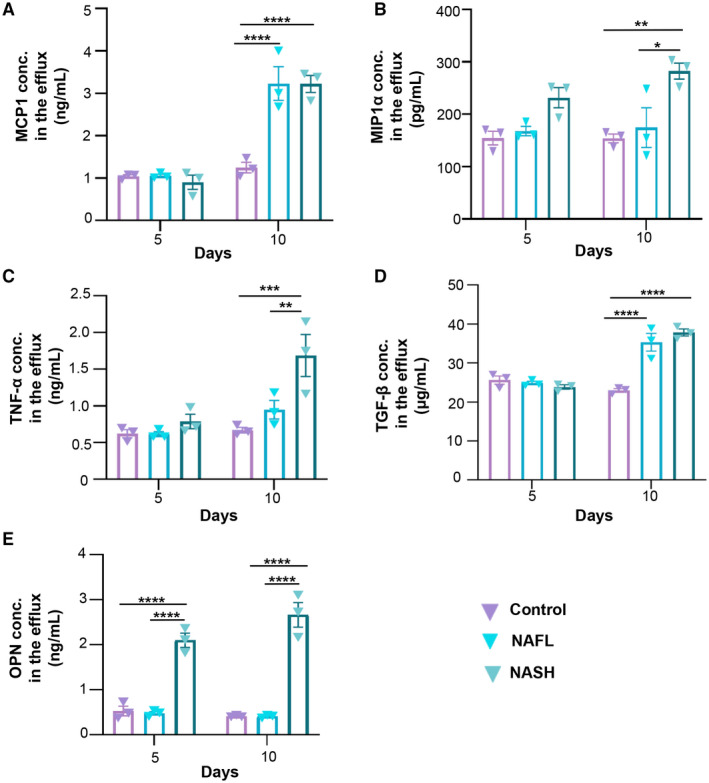
FIG. 7.

Assessment of inflammatory and profibrotic makers of liver cells cultured under healthy and lipotoxic conditions. Concentration levels of inflammatory markers (A) MCP1, (B) MIP1α, and (C) TNF‐α and profibrotic markers (D) TGF‐β and (E) OPN in the effluent media of control, NAFL, and NASH groups after 5 and 10 days. Data are presented as mean ± SEM; n = 3. Significance was calculated using two‐way ANOVA followed by the Bonferroni test, *P < 0.05, **P < 0.01, ***P < 0.005, and ****P < 0.0001. Abbreviation: conc., concentration.
