
FIG. 3.
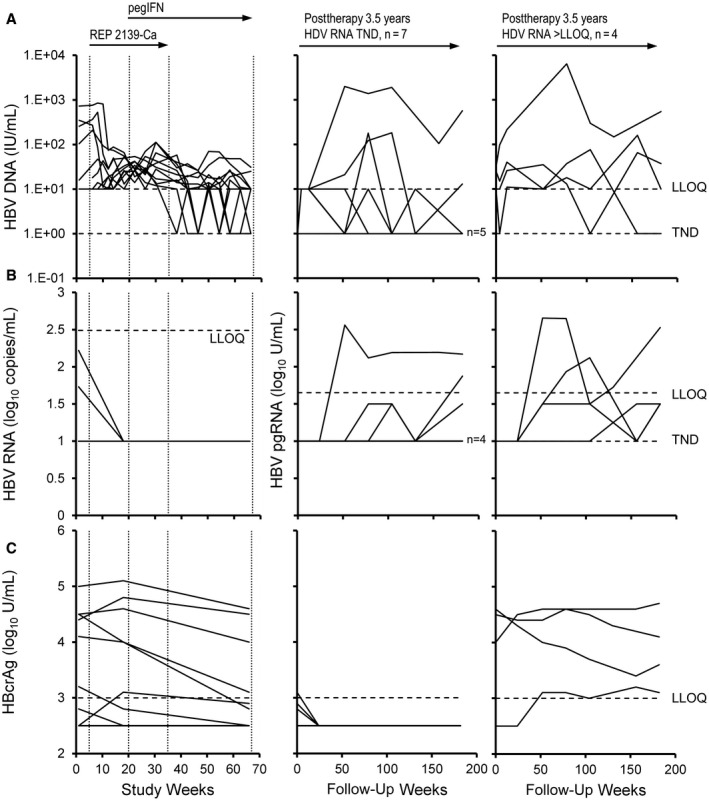
Changes in response in the REP 301 and REP 301‐LTF studies. (A) HBV DNA, (B) HBV RNA, and (C) HBcrAg during therapy (left) and in participants maintaining HDV RNA TND (middle) or >LLOQ (right) at the end of the extended follow‐up. In (B), total HBV RNA is presented during therapy and HBV pgRNA is presented during follow‐up (middle and right). HBV DNA, total HBV RNA, and HBcrAg from baseline to F1Y (FW52) were previously published.( 19 )