Figure 11.

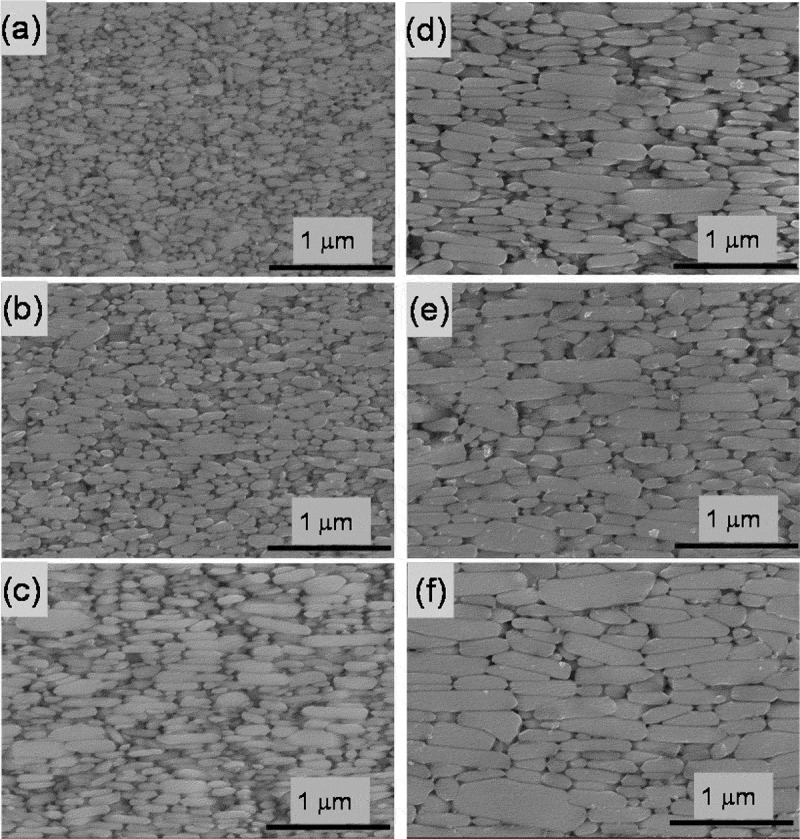
SEM photographs parallel to the c-axis for Samples C after deformation at (a) 725oC; (b) 750°C; (c) 775°C; (d) 800°C; (e) 825°C; and (f) 850°C [26]

SEM photographs parallel to the c-axis for Samples C after deformation at (a) 725oC; (b) 750°C; (c) 775°C; (d) 800°C; (e) 825°C; and (f) 850°C [26]