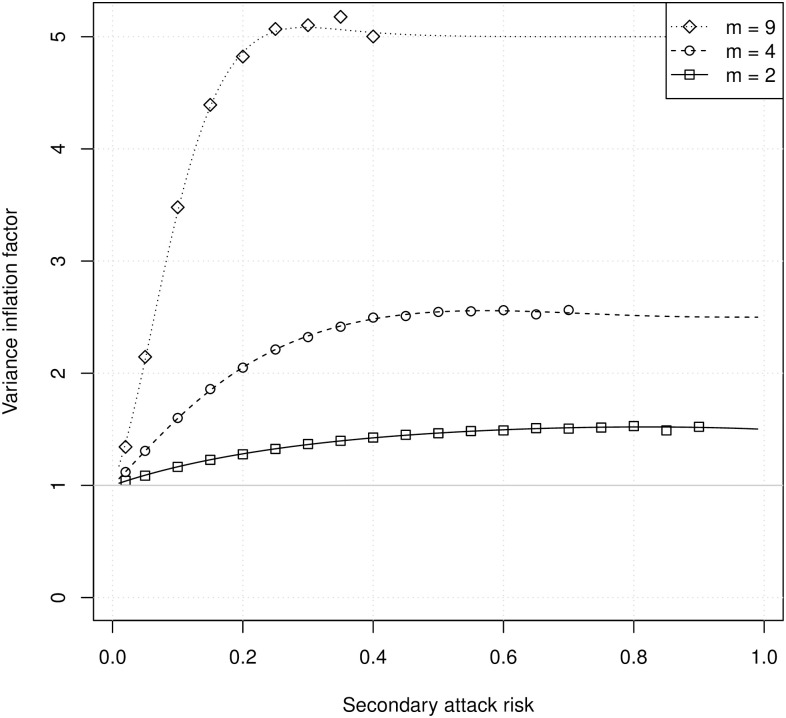
Fig 2. The VIF as a function of the SAR for households with m susceptibles.
Lines show analytical calculations, and symbols show estimates from 40,000 simulated household outbreaks. Each simulated household outbreak started with a single primary case, so the total household size was m + 1. For numerical stability, symbols are shown only for simulations with an observed FAR <0.99.

