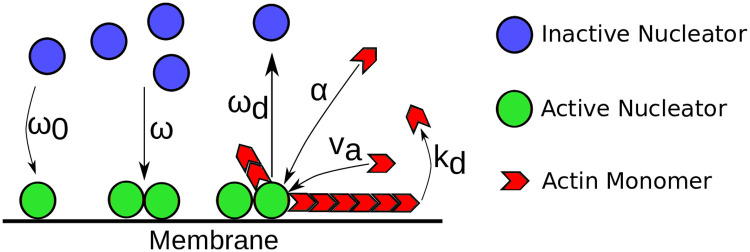
Fig 1. Schematic representation of the actin dynamics captured by Eqs (1)–(4).
Blue circles represent inactive nucleators. They are spontaneously activated at rate ω0, a process that is often associated with membrane binding. The activation rate is enhanced by already active nucleators, represented by green circles, which is captured by the parameter ω. Active nucleators generate new actin filaments (red) at rate α. The latter grow at velocity va and spontaneously disassemble at rate kd. Furthermore, actin filaments attract factors that inactivate nucleators. This complex process, which can involve several different proteins in a cell, is captured by the rate ωd.

