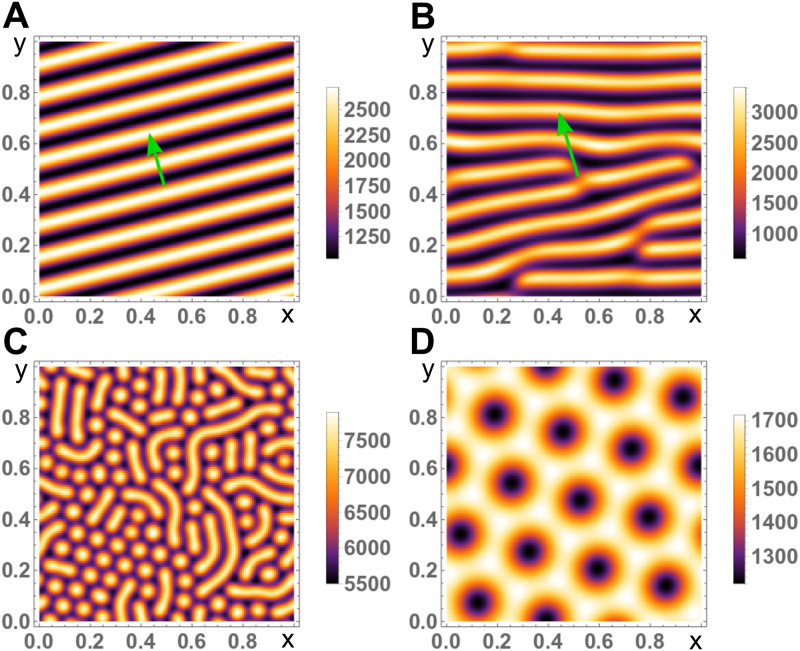
Fig 3. Snapshots of solutions for the actin concentration c to Eqs (1)–(4) in two dimensions with periodic boundary conditions.
A, B) Travelling planar waves for Da = 0.04, ωd = 0.28, va = 0.2 (A) and Da = 0.04, ωd = 0.32, va = 0.44 (B). Green arrows indicate the direction of motion. The disclinations in (B) might heal after very long times. C, D) Stationary Turing patterns for Da = 0.04, ωd = 0.45, va = 6.0 (C) and Da = 0.21, ωd = 0.42, va = 9.5 (D). For different initial conditions a pure hexagonal pattern of blobs can appear. All other parameters as in Table 1.

