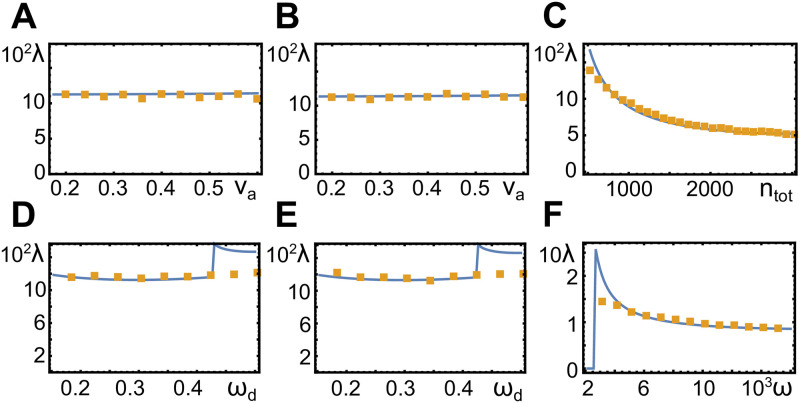
Fig 4. Wavelength as a function of system parameters.
Orange dots represent values obtained from numerical solutions in two spatial dimensions with periodic boundary conditions (L = 1.0), blue lines are the results of a linear stability analysis, see Sect Linear stability analysis. Parameter values are ωd = 0.44 (A), ωd = 0.48 (B), va = 0.46 and ωd = 0.43 (C), va = 0.32 (D), va = 0.48 (E), and va = 0.46 and ωd = 0.43 (F). All other parameters as in Table 1.

