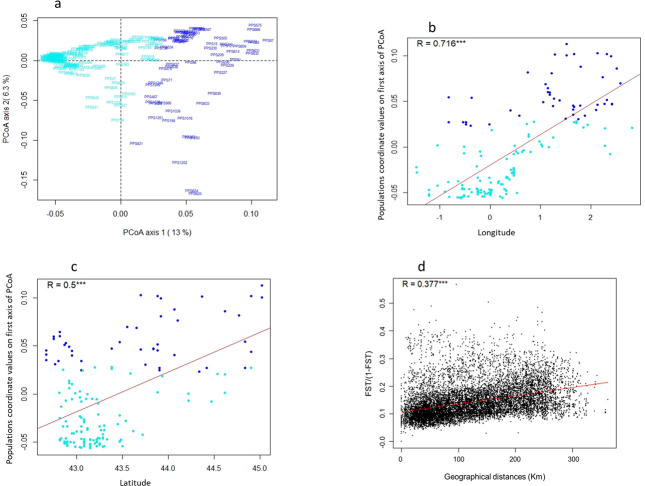
Fig 3. Spatial genetic structuration analysis of SWF landraces.
(a) Principal coordinate analysis on SNP data using Rogers ‘genetic distance matrix estimated among the 194 landraces. (b) Longitudinal and (c) latitudinal gradient analyses on SNP data of 158 landraces from South-West France using coordinates values on the first axis of PCoA analysis. SWF landraces were colored according to their assignation to E-SWF and W-SWF groups identified with admixture analysis at K = 2. (d) Isolation by distance (IBD) analysis of 158 landraces from South-West France using FST / (1- FST) matrix for genetic differentiation estimated following Rousset [32] and geographical distance matrix estimated for each pair of landraces. R = coefficient of correlation. *** = p-value<0.001.

