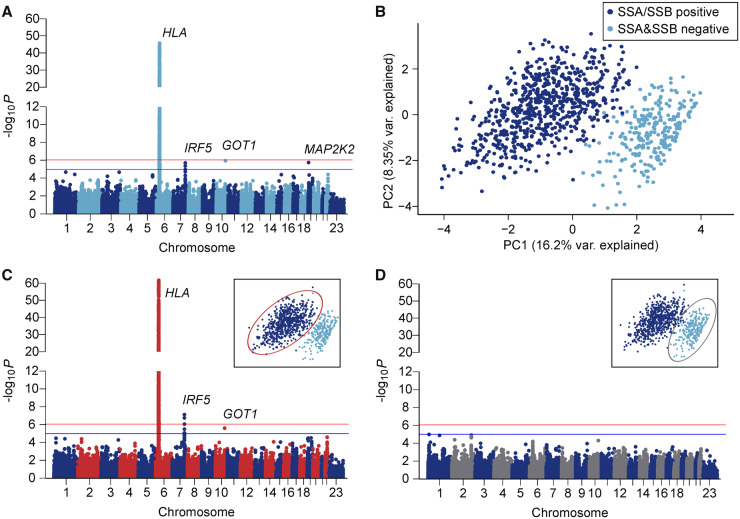
Fig. 1.
Genetic association and subgroup analysis of primary Sjögren’s syndrome patients vs controls
(A) Single variant association analysis between 918 pSS cases and 1264 healthy controls. Logistic regression with minor allele frequency ≥0.01 and three principal components as covariates. A total of 107 045 variants included after quality control. Red line indicates the experiment wide Bonferroni cutoff (P = 8.7 × 10⁻⁷); blue line represents the suggestive significance threshold (P = 1 × 10⁻⁵). (B) PCA of clinical data collected for 982 pSS cases. (C) Single variant association analysis between anti-SSA/SSB positive patients (dark blue in PCA plot) vs controls. (D) Single variant association analysis between anti-SSA and SSB negative patients (light blue in PCA plot) vs controls. PCA: principal component analysis.

