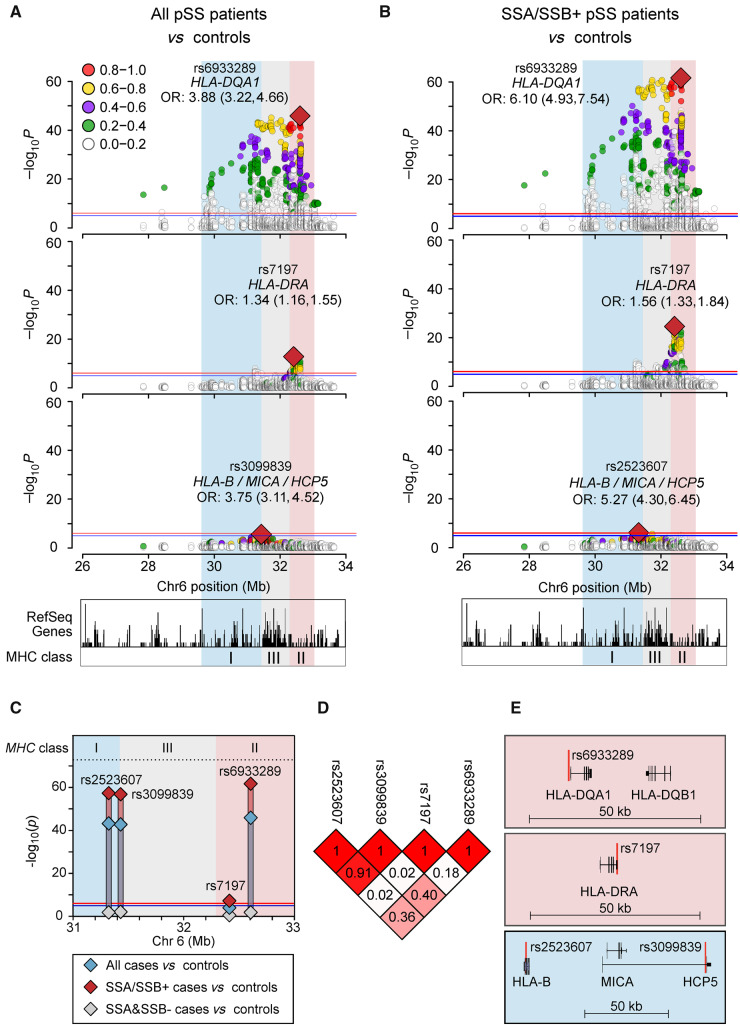
Fig. 2.
HLA associations with primary Sjögren’s syndrome
Stepwise adjustment for the top associated variants. (A, B) Logistic regression analysis of all patients vs controls (A), or anti-SSA/SSB positive patients vs controls (B). Second panel after conditioning on rs6933289, bottom panel after conditioning on rs6933289 and rs7197, with rs3099839 top remaining variant in all cases vs controls, rs2523607 top remaining variant in anti-SSA/SSB positive vs controls. (C) Unadjusted P-values for all cases vs controls (blue), SSA/SSB positive vs controls (red), and SSA and SSB negative vs controls (grey). (D) Linkage disequilibrium (r2) between the variants. (E) Gene regions of the independent HLA variants: HLA-DQA1, HLA-DRA and the HLA-B/MICA/HCP5 locus.

