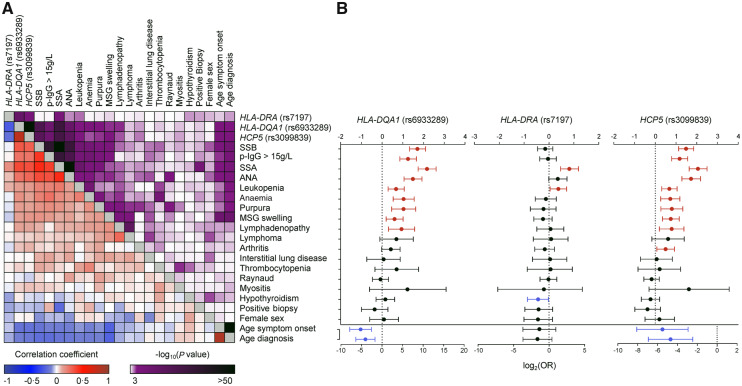
Fig. 3.
Correlations between clinical phenotypes and associated variants
(A) Non-parametric correlations between associated genetic variants and clinical variables. The purple scale represents P-values for the correlation (darker represents more significant), and the blue–red scale represents the correlation coefficient, with darker blue representing stronger negative correlation, and deeper red representing stronger positive correlation. (B) Logistic regression of different clinical variables with risk allele count for the top associated independent genetic variants. Red lines represent significant positive associations, blue lines significant negative associations. Whiskers indicate 95% CI. OR: odds ratio.

