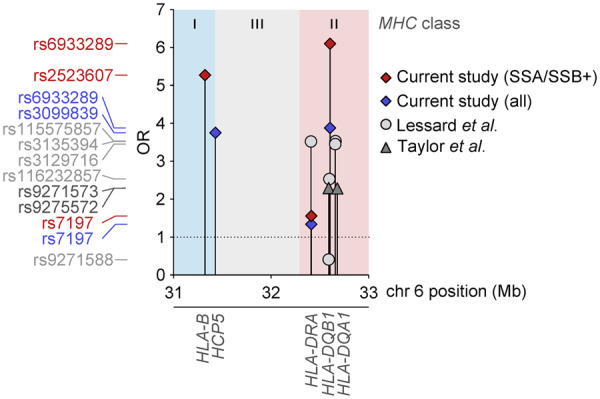
Fig. 4.

Comparison of effect sizes for associated variants in the HLA region
Top variants from Lessard et al. [10] are shown as light grey circles and variants from Taylor et al. [13] are depicted as dark grey triangles. Red diamonds represent SSA and/or SSB positive primary Sjögren’s syndrome associations and blue diamonds represent the full primary Sjögren’s syndrome associations from the current study. Position on chromosome 6 is shown on the x-axis and ORs on the y-axis. The nearest genes are labelled below. OR: odds ratio.
