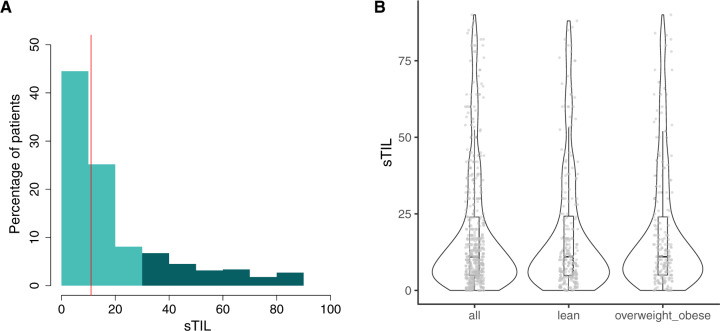
Figure 1.
Distribution of sTIL, BMI, and pCR rates. A) Distribution of sTIL. Light and dark colour indicate low (<30.0%) and high (≥30.0%) sTIL, respectively. The vertical line indicates the median. B) Distribution of sTIL for the complete series and according to the 2 categories of BMI. Violin plots indicate the probability density of the data, and box plots represent the median (bold line) and interquartile range (rectangle). Dots report the distribution of the observed values. BMI = body mass index; pCR = pathological complete response; sTIL = stromal tumor-infiltrating lymphocytes.

