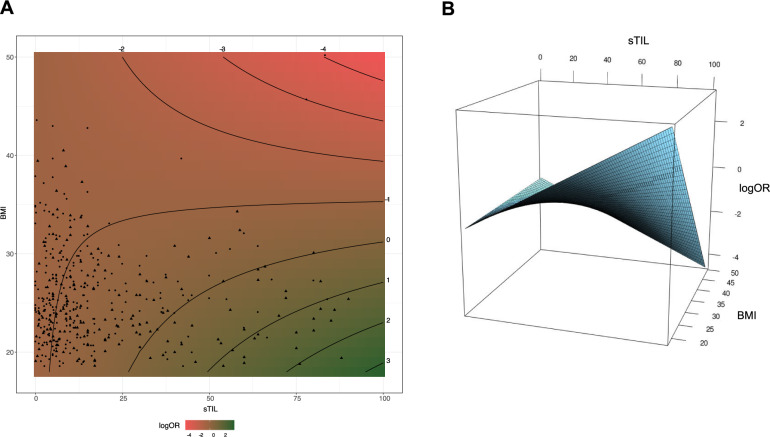
Figure 3.
Interaction between continuous BMI and sTIL regarding pCR. A) Contour representation of logOR for pCR according to BMI and sTIL. logOR is computed in a logistic model adjusted for menopausal status, grade, and stage. The reference for the logOR is taken at 30.0% sTIL and 20 kg/m2 BMI. The scatter plot refers to the supporting patients with patients achieving pCR as triangles, the others as circles. B) Surface representation of logOR for pCR according to BMI and sTIL. BMI = body mass index; OR = odds ratio; pCR = pathological complete response; sTIL = stromal tumor-infiltrating lymphocytes.

