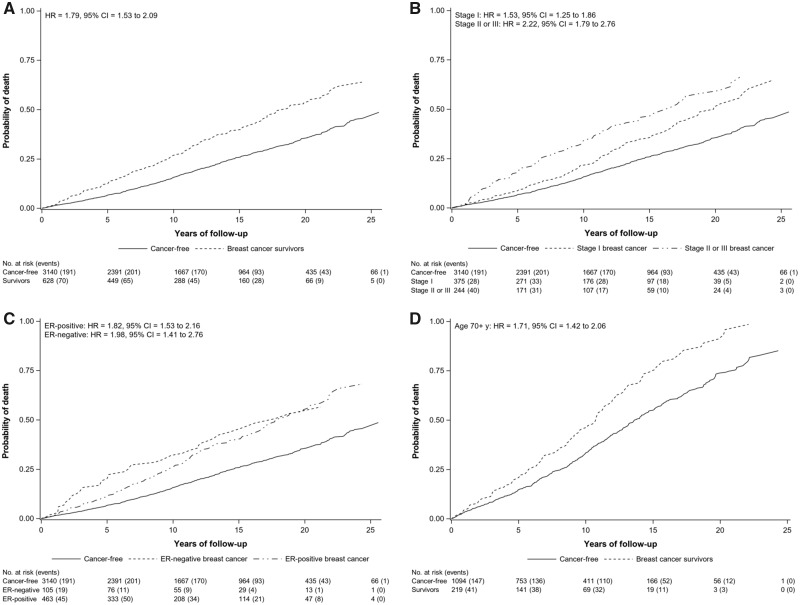
Figure 1.
Adjusted Kaplan-Meier failure curves and hazard ratios (HRs) with 95% confidence intervals (CIs) for all-cause mortality in breast cancer survivors compared with cancer-free women. Figures are presented overall (A) and by stage at diagnosis (B), estrogen receptor (ER) status (C), and restricted to women aged 70 years or older at diagnosis (D). Results are adjusted for age (years), menopausal status (premenopausal, postmenopausal), education (<12, 12, >12 years), smoking status (never, former, current), alcohol intake (<3 drinks/mo, ≥1 drinks/wk), body mass index (<25, 25 to <30, ≥30 kg/m2), and oral hormone use (ever, never) using inverse probability weighting. P values from log-rank tests were less than .001 for figures A–D.

