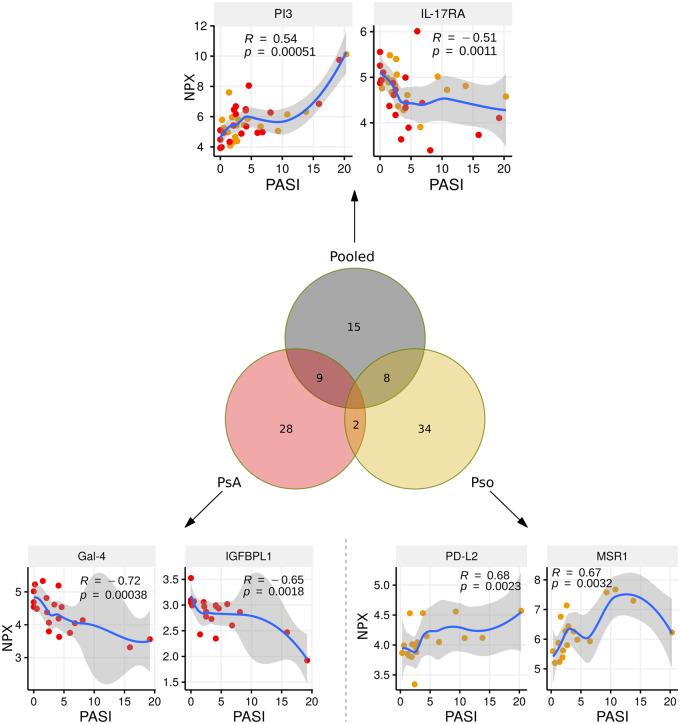
Fig. 4.
Top proteins related to Pso activity
The Venn diagram shows the total number of proteins that significantly correlate to PASI score (nominal P-value <0.05). The analysis was performed when pooling PsA and Pso patients (grey circle), taking PsA patients only (red circle) or taking Pso patients only (orange circle). The PASI was correlated to relative protein levels. Spearman’s rank correlation (R) and P-value are shown in the figure. Locally estimated scatterplot smoothing (loess) curve is shown. Pso: psoriasis; PASI: Psoriasis Area and Severity Index; NPX: Normalized Protein eXpression; PI3: Elafin; IL-17RA: IL-17 receptor A; Gal-4: Galectin-4; IGFBPL1: Insulin-like growth factor-binding protein-like 1; PD-L2: Programmed cell death 1 ligand 2; MSR1: Macrophage scavenger receptor types I and II.

