
Figure 5.
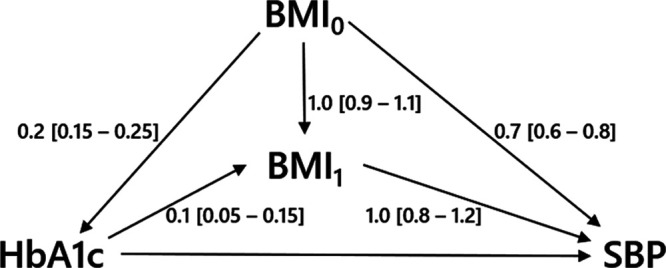
Directed acyclic graph of example 2 with hypothetical values of the relations between  ,
,  , HbA1C, and SBP. BMI, body mass indexl; SBP, systolic blood pressure.
Official websites use .gov
A
.gov website belongs to an official
government organization in the United States.
Secure .gov websites use HTTPS
A lock (
) or https:// means you've safely
connected to the .gov website. Share sensitive
information only on official, secure websites.
Directed acyclic graph of example 2 with hypothetical values of the relations between , , HbA1C, and SBP. BMI, body mass indexl; SBP, systolic blood pressure.