
Figure 6.
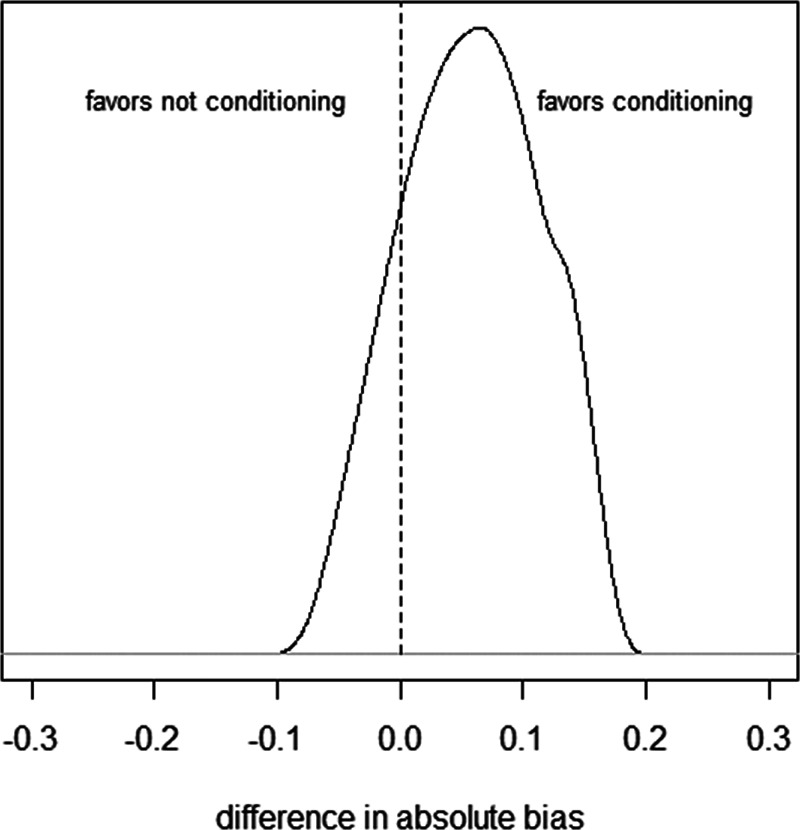
Histogram of difference in absolute bias of conditioning vs. not conditioning on a mediator to control for unmeasured confounding in example 2. Scenarios to the left of the dashed line favor not conditioning on  , scenarios to the right of the dashed line favor conditioning on
  . See main text for details. BMI, body mass index.