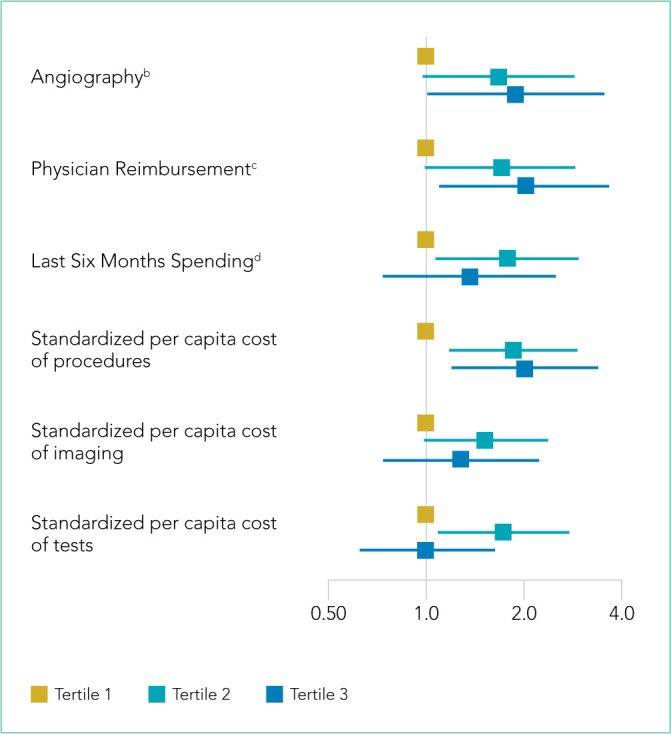
FIG 1.

Adjusted Odds Ratio of Being Classified in a Higher Tertile in the Diagnostic Overuse Index. Calculated as a function of being in a given tertile of a Dartmouth Atlas HSA metric or Medicare county cost metric.
aAdjusted odds ratios were calculated using mixed ordinal logistic regression, controlling for number of hospital beds, teaching status, critical access hospital status, and state fixed effects.
b[Angiography] Rate of inpatient coronary angiograms per 1,000 Medicare enrollees
c[Physician Reimbursement] Price-adjusted physician reimbursement per fee-for-service Medicare enrollee per year
d[Last 6 Months of spending] Mean inpatient spending per decedent in the last six months of life
