Figure 4 (Continued).

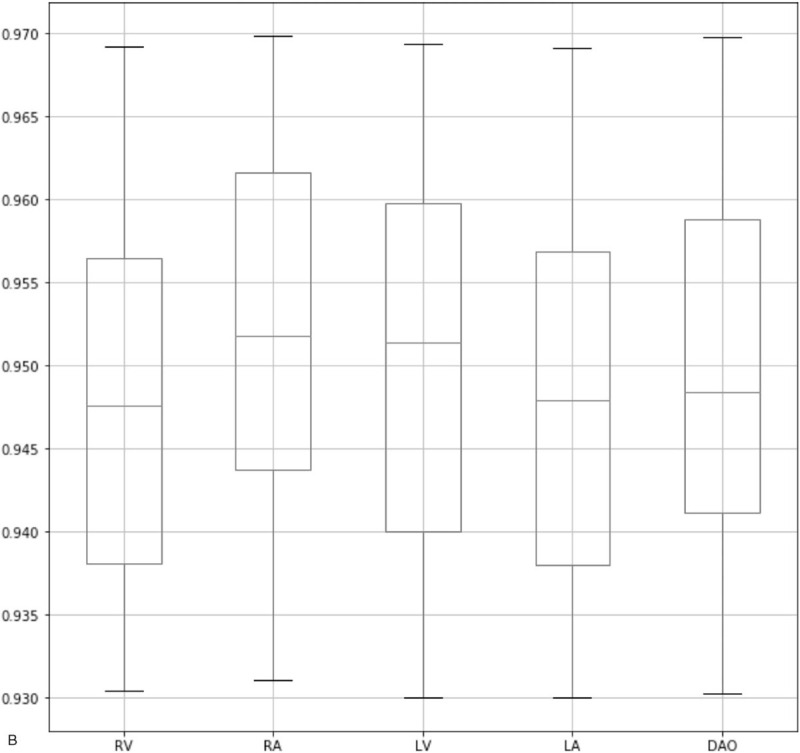
Box-plots of IoU values for 3 sections. The 3 lines on each box represent the 4 quartiles of the IoU values. IoU = intersection over union.

Box-plots of IoU values for 3 sections. The 3 lines on each box represent the 4 quartiles of the IoU values. IoU = intersection over union.