
Figure 3.
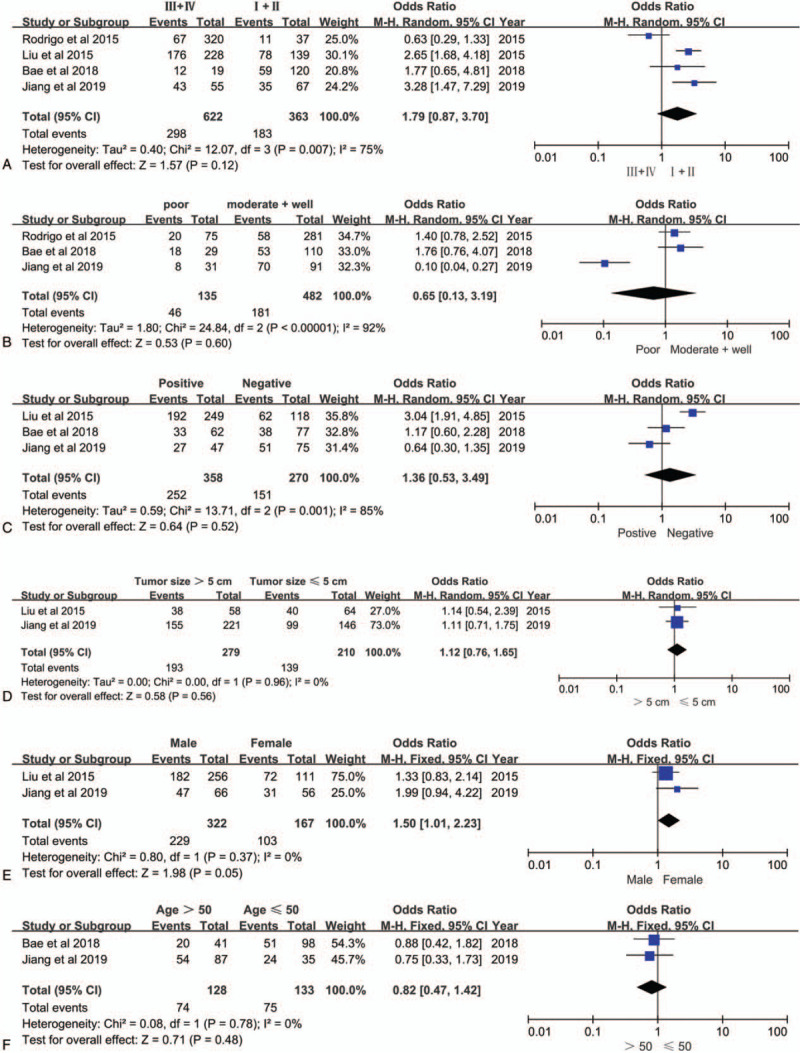
Forest plots of odds ratios for the associations between ANO1 and clinicopathological features in cancers. (A) TNM stage. (B) Histological grade. (C) Lymph node metastasis. (D) Tumor size. E, Gender. (F) Age.
Official websites use .gov
A
.gov website belongs to an official
government organization in the United States.
Secure .gov websites use HTTPS
A lock (
) or https:// means you've safely
connected to the .gov website. Share sensitive
information only on official, secure websites.
Forest plots of odds ratios for the associations between ANO1 and clinicopathological features in cancers. (A) TNM stage. (B) Histological grade. (C) Lymph node metastasis. (D) Tumor size. E, Gender. (F) Age.