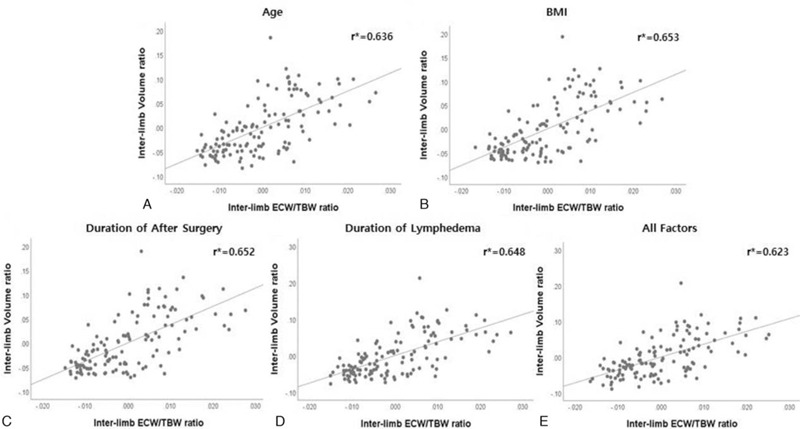
Figure 5.

Correlations between the inter-limb ECW/TBW ratio and inter-limb volume ratio adjusted for age, BMI, postoperative survival, and duration of lymphedema: partial regression plots. r∗ (Partial correlation coefficient) All measured values were converted to square root and used in the statistical analysis.
