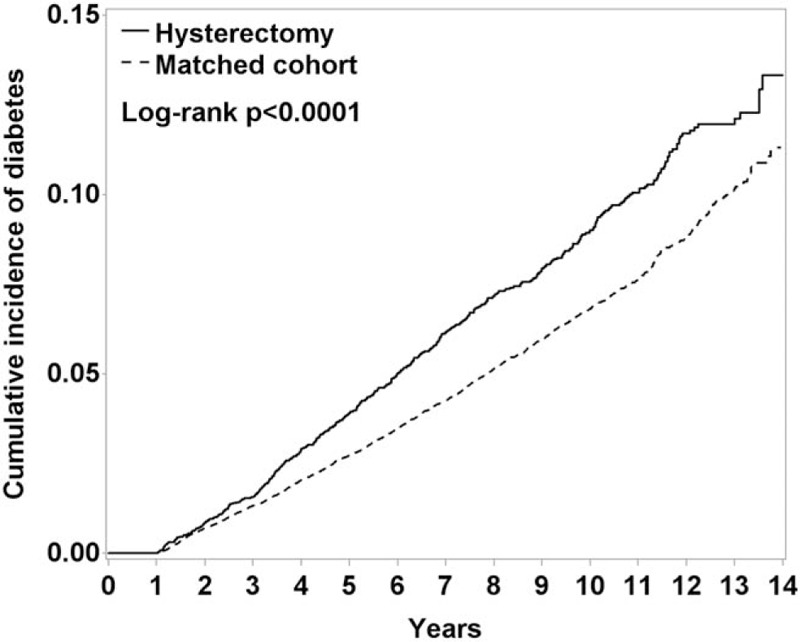
Figure 3.

Kaplan–Meier curves showing the cumulative diabetes mellitus incidence in the hysterectomy group (dashed line) and comparison group (solid line) matched by age and comorbidities.

Kaplan–Meier curves showing the cumulative diabetes mellitus incidence in the hysterectomy group (dashed line) and comparison group (solid line) matched by age and comorbidities.