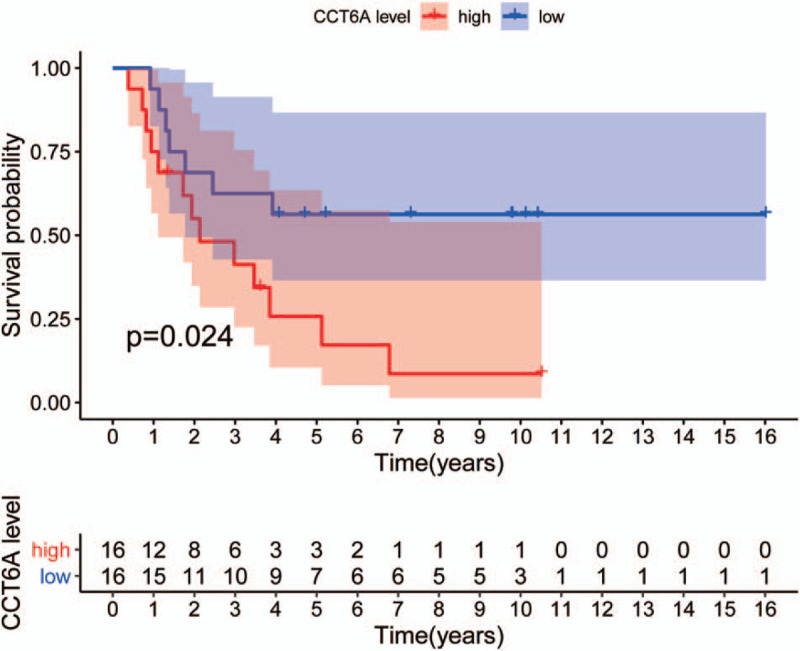
Figure 1.

chaperonin containing TCP1 complex 6A (CCT6A) gene high and low expression group survival curves. Survival curves of patients in the CCT6A high expression group (red curves) and patients’ survival curves in the CCT6A low expression group (blue curves). The x-axis indicates survival time (years), and the y-axis indicates survival probability. Kaplan–Meier survival curves showed that patients in the CCT6A high expression group had worse endpoints for predicting overall survival. In contrast, patients in the CCT6A low expression group had better outcomes for predicting OS than high expression, and the difference was statistically significant (P = .024).
