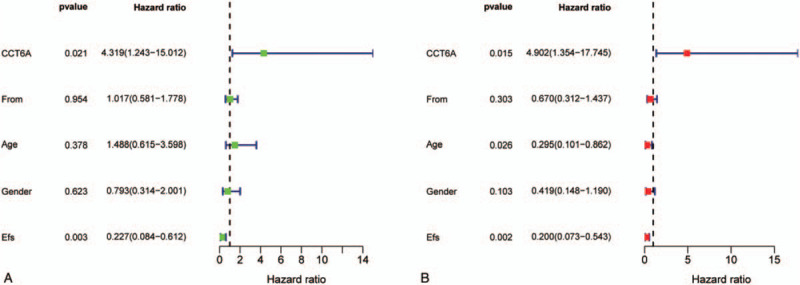
Figure 2.

Survival-related Cox regression analysis plots. A and B plots show univariate Cox regression analysis and multivariate Cox regression analysis, respectively. The horizontal coordinates of both graphs represent hazard ratio (HR), and the vertical coordinates are different variables. HR > 1 indicates a high-risk factor, and HR < 1 indicates a low-risk factor. In the univariate Cox regression analysis in Figure A, chaperonin containing TCP1 complex 6A and event-free survival are statistically significant (P-value < .05). The multifactorial Cox regression analysis in Figure B, chaperonin containing TCP1 complex 6A, Age, and event-free survival has statistically significant (P-value < .05).
