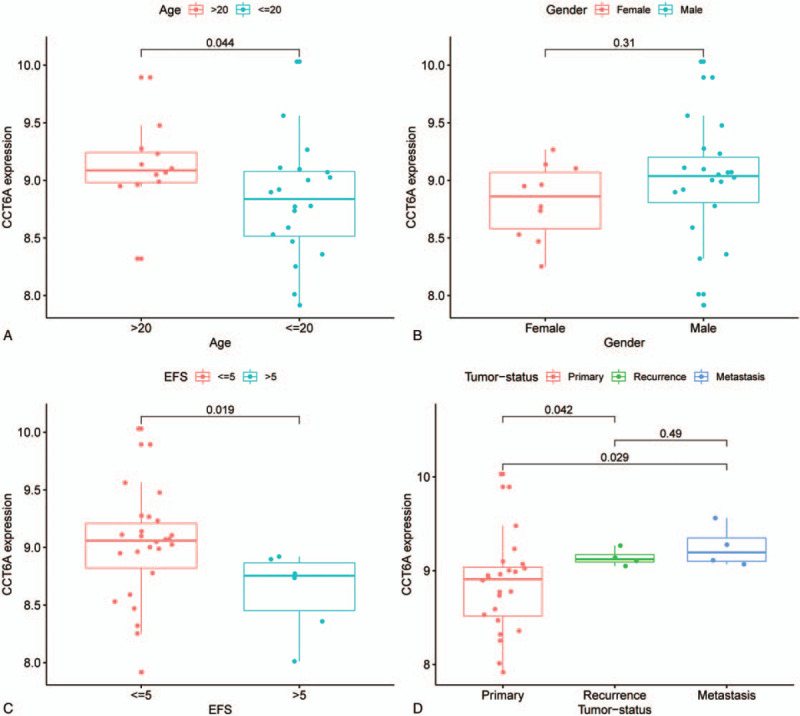
Figure 3.

chaperonin containing TCP1 complex 6A (CCT6A) gene expression in different subgroups. X-axis all indicate different groupings, and Y-axis all indicates the gene expression level of CCT6A. Figure A shows the expression levels of CCT6A in different age groups. The median value of the gene expression of CCT6A in the >20-year-old patient group was lower than in the <=20-year-old patient group, and the difference was statistically significant (P-value = .044). Figure B shows the gene expression of CCT6A in different genders. The median CCT6A gene expression was more significant in the male group than in the female group, and the difference was not statistically significant (P-value > .05). Figure C shows the expression of CCT6A in different event-free survival groupings. The median gene expression value of CCT6A was much higher in the event-free survival<= 5-year group than in the >5-year group, and the difference was statistically significant (P-value = .019). Figure D shows the gene expression levels of CCT6A in different tumor sources. The difference between the Primary and Recurrence groups was statistically significant (P-value = .042), and the difference between the primary and metastasis groups was statistically significant (P-value = .029).
