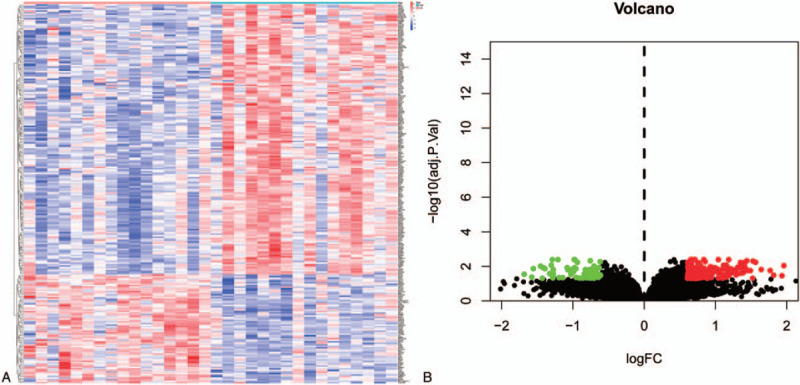
Figure 4.

Heat map and volcano diagram of differential genes. Figure A shows the heat map of differential genes. Red represents high expression, blue represents low expression, and white represents intermediate expression. There are 178 genes with high expression values in the high expression group and 72 genes with decreased expression in the low expression group. Figure B shows the volcano of differential genes. X-axis indicates logFC value, y-axis indicates -log10P-value. Red dots indicate up-regulated genes, green dots indicate down-regulated genes, and black dots indicate genes with insignificant differences.
