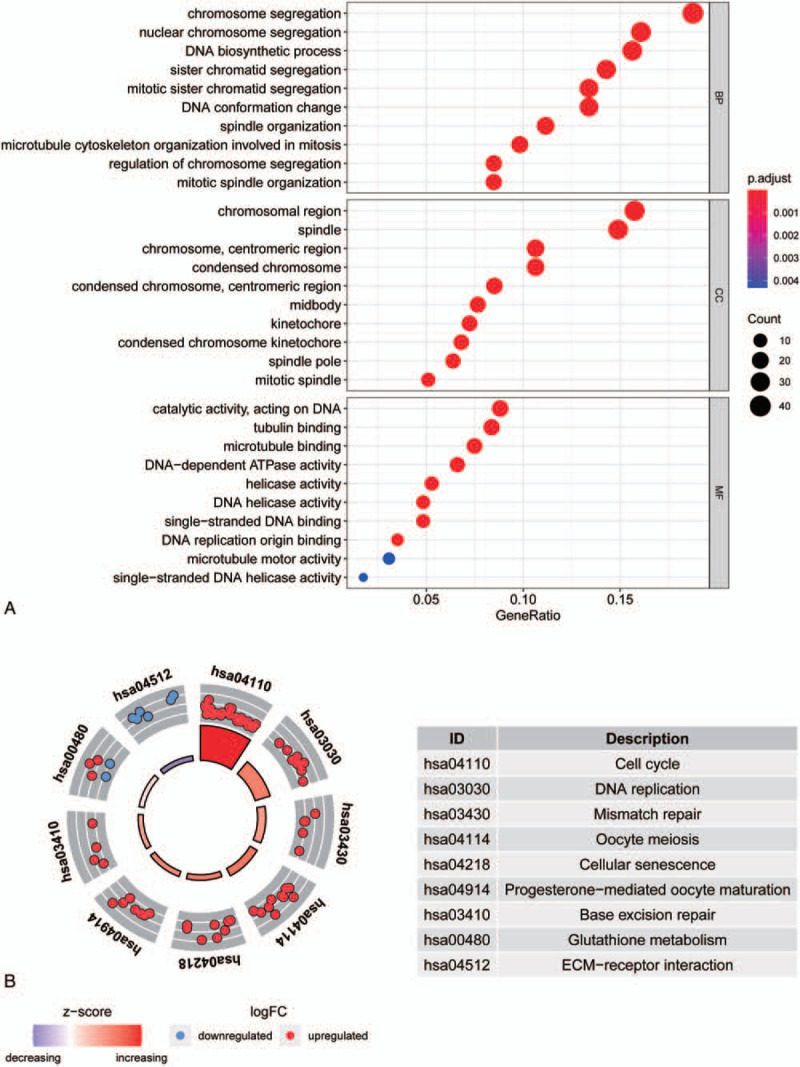
Figure 6.

genome ontology (GO) enrichment analysis of differentially expressed genes and KEGG enrichment analysis. Figure A shows the top 30 entries of BP, CC, and MF for GO enrichment analysis of differentially expressed genes. The X-axis shows the gene ratio of each entry; Y-axis shows the GO entries. Figure B shows the enrichment pathway of KEGG. Inner circles indicate z-scores, outer circles indicate gene enrichment pathways, red dots indicate up-regulated genes, and blue dots indicate down-regulated genes.
