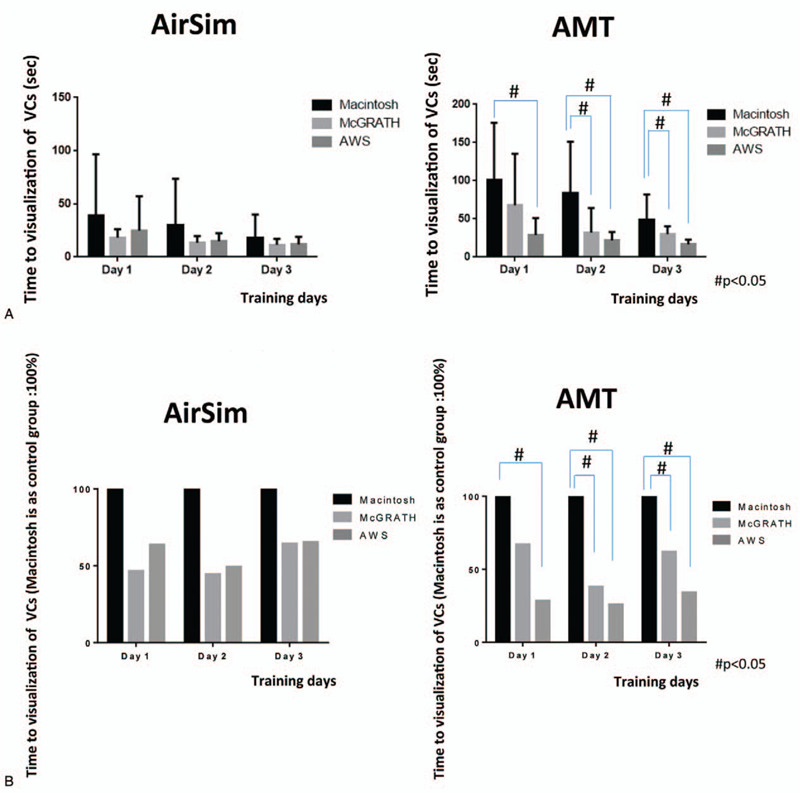
Figure 4.

Time between holding the laryngoscope and vocal cord (VC) visualization in each group on the 3 days (AirSim vs AMT). Actual time data was shown in Figure 4(A). Figure 4(B) indicates the percentage change relative to the Macintosh group (considered as 100%). #In the AMT study, the time until visualization of the VCs was significantly shorter with the McG than the Mac on days 2 and 3, and that with the AWS was significantly shorter than with the Mac on all 3 days.
