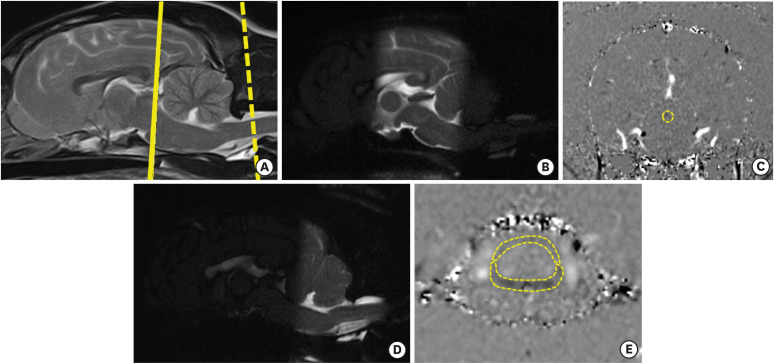
Fig. 1. A sagittal T2W image showing the cerebral aqueduct level (solid line) and foramen magnum level (dashed line) (A). Time-SLIP sagittal plane images and PC-MR transverse plane images at the cerebral aqueduct (B,C) and foramen magnum level (D,E). As shown in the (C and E), measurements are made in 3 ROIs; cerebral aqueduct and the dorsal and ventral aspects of the SAS.
T2W, T2 weighted; Time-SLIP, time-spatial labeling inversion pulse; PC, phase-contrast; MR, magnetic resonance; ROIs, regions of interest; SAS, subarachnoid spaces.

