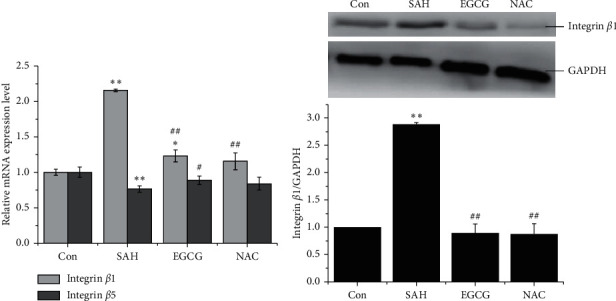
Figure 2.

EGCG inhibited the overexpression of integrin β1 after SAH. (a) EGCG regulated integrin β1 and integrin β5 mRNA expression level in in vivo SAH model. (b) Identification of integrin β1 protein level in in vivo SAH model (upper panel) (n = 3), and quantification of the expression of integrin β1 (lower panel). SAH: 30 μL of OxyHb (150 μmol/L); EGCG: 50 mg/kg/d; NAC: 150 mg/kg. A representative trace of three repeats of each experiment is shown. ∗p < 0.055 vs. control, ∗∗p < 0.01 vs. control, #p < 0.01 vs. SAH, and ##p < 0.01 vs. SAH.
