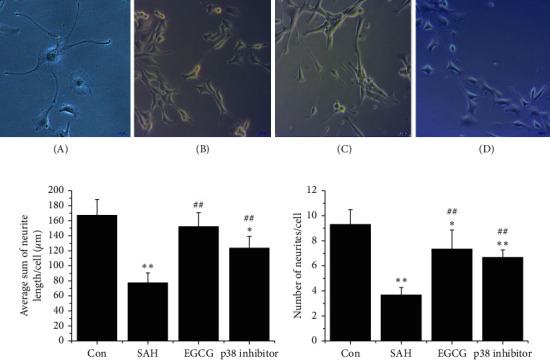
Figure 4.

EGCG induced PC12 cells neurite outgrowth. (a) The morphology of NGF-induced PC12 cells after SAH in vitro. (A) Control; (B SAH (at a final concentration of 10 μM OxyHb; (C) EGCG (50 μM); (D) NAC (2.5 μM). Bar, 200 μm for (A) and 100 μm for (B–D). (b) The length of neurites after SAH. (c) The average number of neurites per cell after SAH. A representative trace of three repeats of each experiment is shown. ∗p < 0.05 vs. control, ∗∗p < 0.01 vs. control, and ##p < 0.01 vs. SAH.
