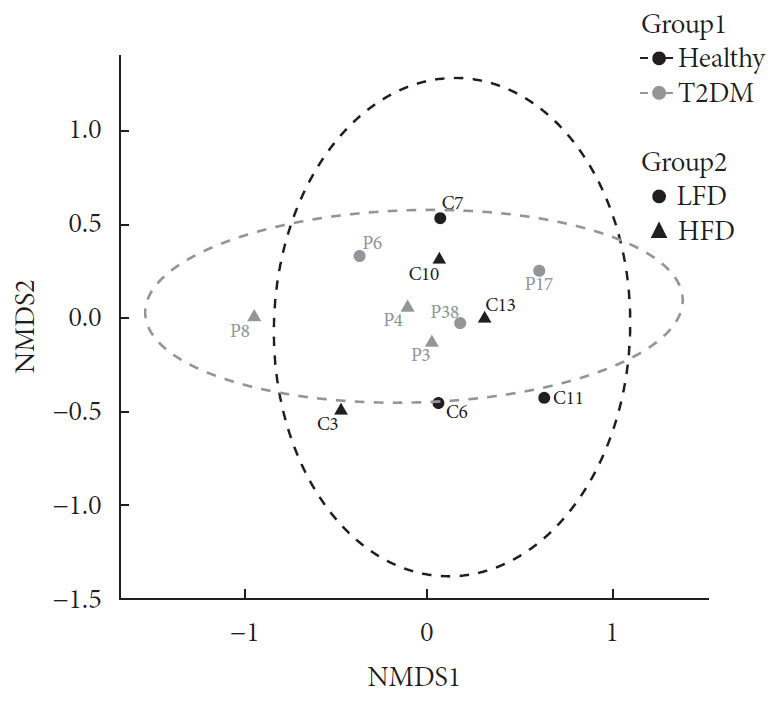
Fig. 1. Evaluation of community composition among samples. Panel shows non-metric multidimensional scaling (NMDS) ordination. Ordination plots were categorized by color according to the patient health status (Group 1) and by shape according to their diet (Group 2). T2DM, type 2 diabetes mellitus; LFD, low fiber diet; HFD, high fiber diet.

