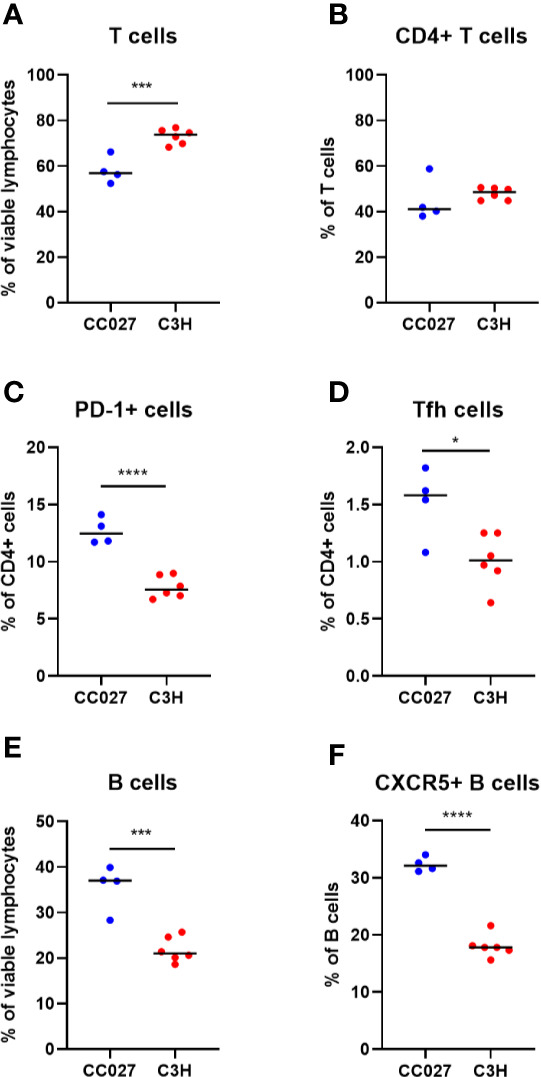
Figure 3.

Lymphocyte subsets in mesenteric lymph nodes from CC027/GeniUnc (n = 4) and C3H/HeJ mice (n = 6). (A) T cells, (B) CD4+ T cells, (C) PD-1+ CD4+ cells, (D) T follicular helper cells, (E) B cells, and (F) CXCR5+ B cells. *p < 0.05, ***p < 0.001, ****p < 0.0001, Unpaired t test, individual data are shown with a black line representing the median.
