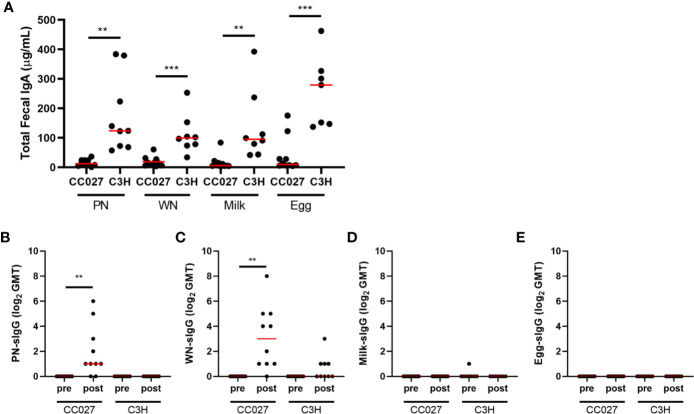
Figure 5.
Fecal immunoglobulin quantities. (A) Total fecal IgA measured in peanut-, walnut-, milk-, or egg-exposed CC027/GeniUnc (n = 10 per food) and C3H/HeJ (n = 7–9 per food) mice. (B–E) Fecal peanut- (B), walnut- (C), milk- (D), and egg- (E) specific IgG (represented as log2 of the geometric mean titer (GMT)) in food protein-exposed CC027/GeniUnc (n = 9–10 per food) or C3H/HeJ (n = 7–9 per food) mice. **p < 0.01, ***p < 0.001, Unpaired t test (IgA) and Wilcoxon test (IgG), individual data are shown with a red line representing the median.

