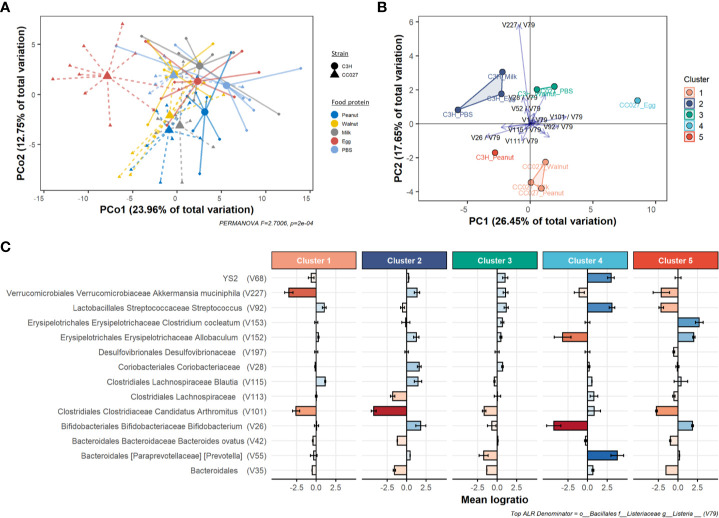
Figure 6.
Gut microbiome changes after food protein exposure in CC027/GeniUnc (n = 7–10 per food) and C3H/HeJ (n = 7–8 per food) mice. (A) PCoA plot of compositional perturbation explaining 36.71% of total variation grouped by strain-food protein. (B) PCA biplot showing relative location of clusters and how the mean strain-food protein log-ratios within the perturbation signature contribute to differences between groups. (C) Depletion or enrichment of specific taxa relative to Listeria within each cluster. Error bars reflect 95% confidence intervals of the mean log-ratio value for all samples within each cluster. All taxa information is included in the following sequence: order, family, genus, species.

