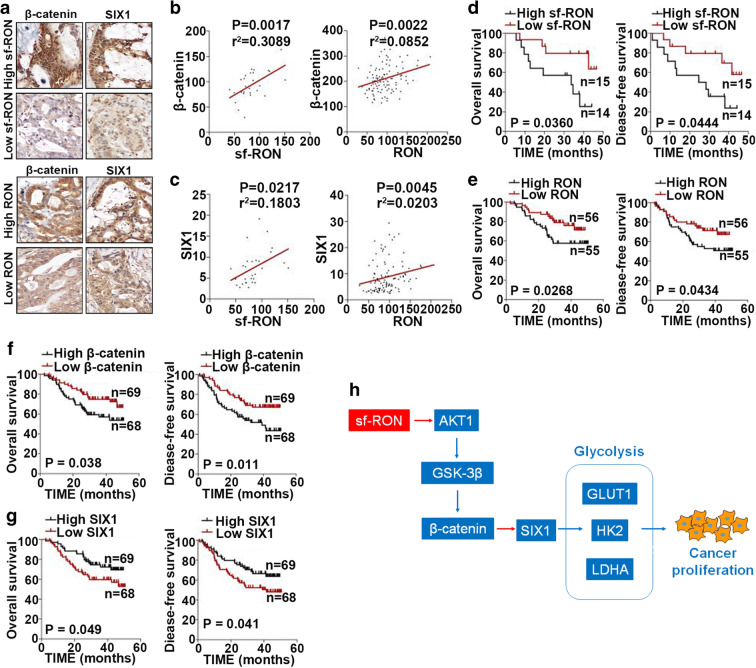
Fig. 6.
The associations among the expression of sf-RON, RON, β-catenin and SIX1, and survival of gastric cancer patients. a Representative images of biopsies containing the expression of β-catenin and SIX1 in gastric cancer patient tissues with low and high expression of sf-RON and RON (× 400). b, c Correlation of sf-RON and RON expression with β-catenin and SIX1. d–g Kaplan-Meier OS survival curves (log-rank tests) and PFS survival curves (log-rank tests) of patients with varying sf-RON, RON, β-catenin, and SIX1 expression. h Schematic model showing the role of sf-RON/β-catenin/SIX1 signaling axis in the regulation of cell proliferation and glucose metabolism in the GC cells

